Are your learning and development (L&D) programs actually working? Are employees completing courses, retaining knowledge, and applying new skills on the job? To find out, focus on the right L&D key performance indicators (KPIs).
The top 10 data points that define the success of your initiatives are:
- Training completion rates
- Knowledge retention
- Time-to-competency
- Learner engagement
- Employee productivity post-training
- Promotion and career progression rates
- Training ROI
- Skills gap analysis results
- Session feedback and satisfaction scores
- Turnover rates post-training
Tracking these learning and development metrics helps you see whether your L&D programs are driving performance, engagement, and retention — and where they can improve. Let’s look at why L&D KPIs are so critical for long-term success.
Why Should I Use L&D KPIs?
Continuous learning is more important than ever — 91% of L&D professionals agree. LinkedIn research found that 100% of companies that are “career development champions” are achieving positive results like increased internal mobility and skills acquisition. Do you know if your L&D programs are having a similar effect?
If not, now is the time to change that. Your company’s employee training and development initiatives have arguably never been more important than today. 39% of employees’ current skills will be outdated by 2030, according to the World Economic Forum. Over 70% of employers say finding employees with the right skills has been difficult, so companies are already having enough trouble finding candidates.
At the same time, employees are more than willing to learn new skills. In fact, they’re seeking those opportunities — 52% would leave their job for one with continuous L&D. There’s never been a better time to take control of employee learning and gain a true understanding of its impact.
Without reliable data, you can only guess, and guesswork doesn’t lead to growth. It could even mean resources wasted on training that isn’t useful or programs that don’t address skills gaps. You also miss chances to foster employees’ strengths and guide them toward leadership positions or other internal promotions.
A disconnect between L&D programs and real results is frustrating for everyone. Your efforts to set up programs go unnoticed, employee performance doesn’t improve, and leaders can’t determine return on investment (ROI). Tracking training and development KPIs makes all the difference.
Learning and development KPIs give you real insight into what’s working and what’s not so that programs actually work for your employees. L&D becomes more targeted, resources are used efficiently, and you have the data to prove the value of training to stakeholders. With the right training metrics, you can connect learning and development to real outcomes, taking it from a nice perk to a powerful business strategy.
10 Training & Development KPIs To Track
Look at a selection of important learning and development KPIs to monitor your company’s L&D trends. Go beyond surface-level stats for a more nuanced understanding of learning program performance.
Let’s dig into 10 key metrics to track and why they matter.
1. Training Completion Rates
Program or course completion rates measure the percentage of employees who finish assigned training courses within a set timeframe. It’s a baseline metric for measuring participation, showing how many employees are engaging with your training initiatives.
This is a common but useful training and development KPI. It tells you whether employees find the content engaging and enables you to pinpoint where participants drop off. Do they tend to quit halfway through, or are few employees starting the course in the first place?
A low completion rate might indicate issues with course content, scheduling, or employee motivation. Engaged learners committed to their professional development drive high completion. Compare rates across modules, departments, and more to dig even deeper.
2. Knowledge Retention
It’s one thing for employees to attend or complete training, but another for them to actually retain the information. Knowledge retention rate measures how much information your employees retain, typically assessed through follow-up assessments or quizzes. This KPI helps you assess the long-term impact of your L&D initiatives on job performance.
If retention rates are low, it may suggest that the material is too complex or is being delivered ineffectively. It could also indicate a lack of reinforcement in the workplace — few chances to practice the new skill. If it’s the opposite, you can rest assured that your learning methods are working.
Strong knowledge retention translates directly into skills employees can apply on the job, making this metric essential for determining the value of your programs. If learning doesn’t stick, the effort and resources spent on training are wasted.
3. Time-to-Competency
Time-to-competency measures how quickly new hires or existing employees become proficient in their roles after completing training. Like Knowledge Retention Rate, this L&D KPI is crucial for evaluating the effectiveness of your training methods and content. It’s especially valuable to know for roles with steep learning curves.
If this metric is high, it could indicate that your learning materials are unclear or outdated. It could also mean that the delivery methods aren’t working, and you need to explore new ways of presenting information.
A shorter time-to-competency means employees are ready to deliver results faster, driving efficiency across teams. It also directly affects employee satisfaction and confidence at work. That’s no surprise — Gallup research has long shown that understanding expectations is key to employee engagement.
4. Learner Engagement
Learner engagement tells you how much employees actively participate during training via interactive modules, discussions, or quiz responses. This metric gives you insight into learners’ commitment and interest levels.
A low engagement rate might mean that employees aren’t interested in the topic, or the course is hard to access or tedious. A high engagement rate tells you the course is relevant to your people and presented in a format that works for them.
The more engaged your learners, the more likely they are to absorb and apply new knowledge as they work. That leads to improved performance and more creative problem-solving.
5. Employee Productivity Post-Training
One of the most direct indicators of training success is its impact on productivity. If employees are acquiring new skills through your L&D efforts, it should be reflected in their output and work quality. Compare productivity before and after training programs are completed to determine whether they worked.
When you do see increased productivity, you can justify continued investment in training and contribute to achieving business goals.
6. Promotion & Career Progression Rates
A goal of employee development is often to increase internal mobility rates, whether through promotions or other forms of career advancement. This KPI measures whether your L&D initiatives are achieving that by analyzing internal movement over a defined period. It tells you whether your programs are working and if your company is committed to internal growth.
A high rate indicates that your L&D efforts are effectively preparing employees for senior roles, encouraging growth and retention. A low rate of internal mobility might tell you that career development strategies or promotion practices might need a revamp to ensure there are clear, attainable pathways to progress.
7. Training ROI
Measuring the ROI of your training programs tells you how much value they deliver compared to what was spent on them. This is a broad KPI that can be calculated by weighing performance improvements, productivity gains, and retention rates against the costs of implementing and delivering L&D.
Training ROI tells you whether programs are worth the investment and their impact on business outcomes. It helps you build a solid case for future L&D budgets and identify the programs that deliver the most value. Your L&D strategies should always aim for measurable, tangible outcomes, and ROI serves as the proof in the pudding.
8. Skills Gap Analysis Results
Analyzing skills gaps shows you whether employees have the skills to meet your company’s needs now and in the future. When you can see the difference between the current competencies of your workforce and the skills they’ll need to take your business forward, your HR and L&D teams can pinpoint priority training needs.
Knowing your skill gaps enables you to support proactive talent development. Ensure your people are equipped with the skills they need to meet future challenges.
9. Session Feedback & Satisfaction Scores
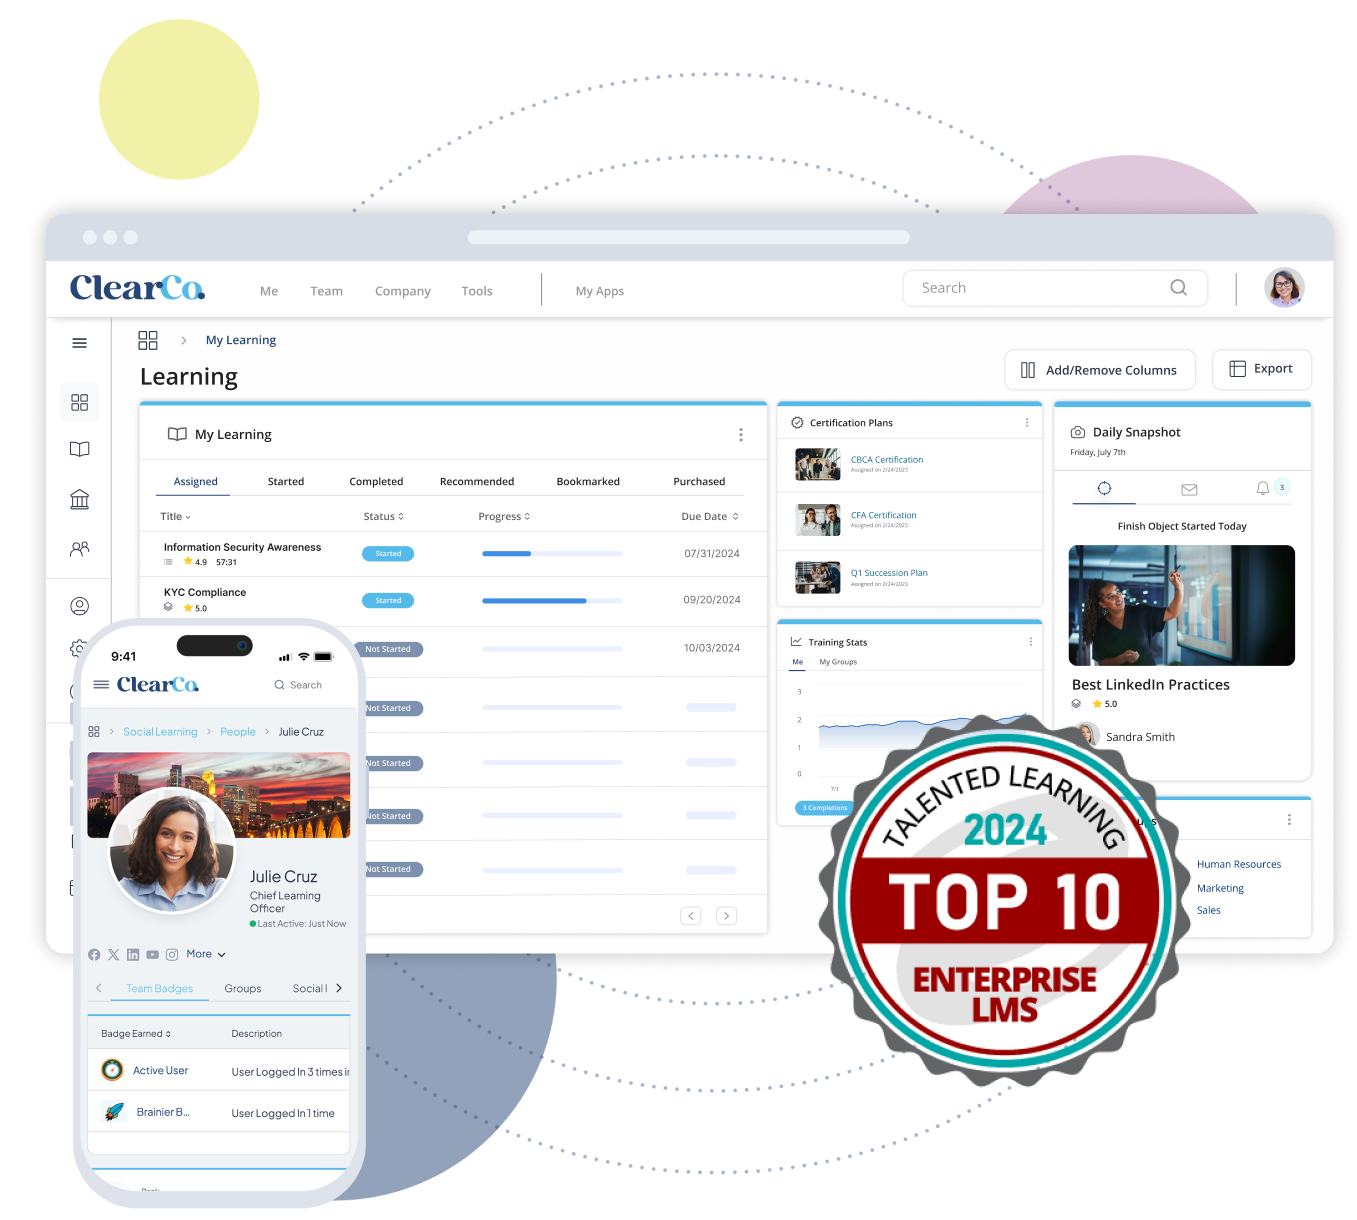
If you’re using software like a learning management system (LMS) to manage your L&D programs, you can easily capture immediate feedback from your employees. Did they find the content relevant and useful? Did they like the course format, or do you need to explore other delivery methods?
High satisfaction scores indicate that employees are happy with course content and delivery, and consistent feedback gives you valuable insight into where you can make improvements. Monitoring employee input helps you keep courses engaging and aligned with your people’s learning needs — an essential part of improving L&D programs over time.
You can also look at changes in customer satisfaction over time. If your goals include higher customer survey scores, faster ticket resolution rates, or increased client retention, these outcomes may reflect the success of your training and show how improving L&D programs directly supports business performance.
10. Turnover Rates Post-Training
We’ve mentioned that L&D is a huge factor in employee turnover. Measuring turnover before and after training programs tells you how it influences employees’ feelings of loyalty. Most people, especially younger generations, say development opportunities are a top reason both for staying at their companies and for taking new jobs. More than 90% of L&D leaders agree.
A post-training decline in turnover suggests your development efforts are boosting employee engagement, satisfaction, and commitment as expected. If turnover isn’t impacted or increases, you may need to address more than just access to training. It might indicate a larger disconnect between your people and company culture or growth opportunities.
How To Start Tracking L&D KPIs
While some organizations have well-defined initiatives, many programs are informal. Even when training is required, or employees follow a common company career path, learning data is often disconnected from other employee data.
That’s if it’s managed with software at all — employee learning is often executed with third-party software or a consulting firm. It can be nearly impossible to link learning outcomes to productivity, engagement, or retention.
When you use a learning management system (LMS) to measure L&D KPIs, you can break down those silos. Here’s a simplified look at how:
- First, integrate your LMS with your HR and performance management systems, or choose a complete talent management system. This way, your data is unified, available in one system, so that L&D results can be correlated with key employee metrics.
- Then, leverage the built-in analytics and reporting tools in your LMS to set benchmarks, monitor progress, and quickly identify areas that need improvement.
- Finally, use the insights you uncover to help refine your training content and delivery methods and ensure that your L&D initiatives drive business success.
Turn Learning Data Into Business Growth
Connecting your learning data to performance, engagement, and retention turns L&D into a true business growth driver. With the right LMS, you can easily track KPIs, uncover what’s working, and continuously improve your programs.
Ready to prove — and improve — the impact of learning? Start tracking essential L&D metrics with ClearCo.