So, you found the best learning management system (LMS) and now your learning and development (L&D) programs are up and running. But L&D isn’t just set it and forget it. You need to make sure it’s working — engaging your employees and leading to meaningful improvement and skills development. To achieve this, you need to understand how your learners interact with course content and how you can make their experience even better.
That’s where LMS analytics — one of the biggest benefits of using an LMS — comes in. LMS analytics provide the data you need to make informed decisions, track progress, and refine programs with confidence. And there’s no time to waste. 2025 learning and development trends show that L&D is at the top of employees’ priority list, and companies doing L&D right are rising to the top of their game.
- 100% of “career champions,” companies with robust L&D programs, are achieving positive business results.
- 71% of career champions are confident they can attract top talent.
- 90% of Millennial employees and job seekers say development and training are what they want most from their employers.
Keep reading to learn what LMS analytics are, why they matter for your team’s growth, and which metrics actually move the needle. Whether you’re looking to boost engagement, raise completion rates, or customize training, you’ll find practical tips ahead.
Let’s see how smart use of data can level up both learning and business results.
What Are LMS Analytics?
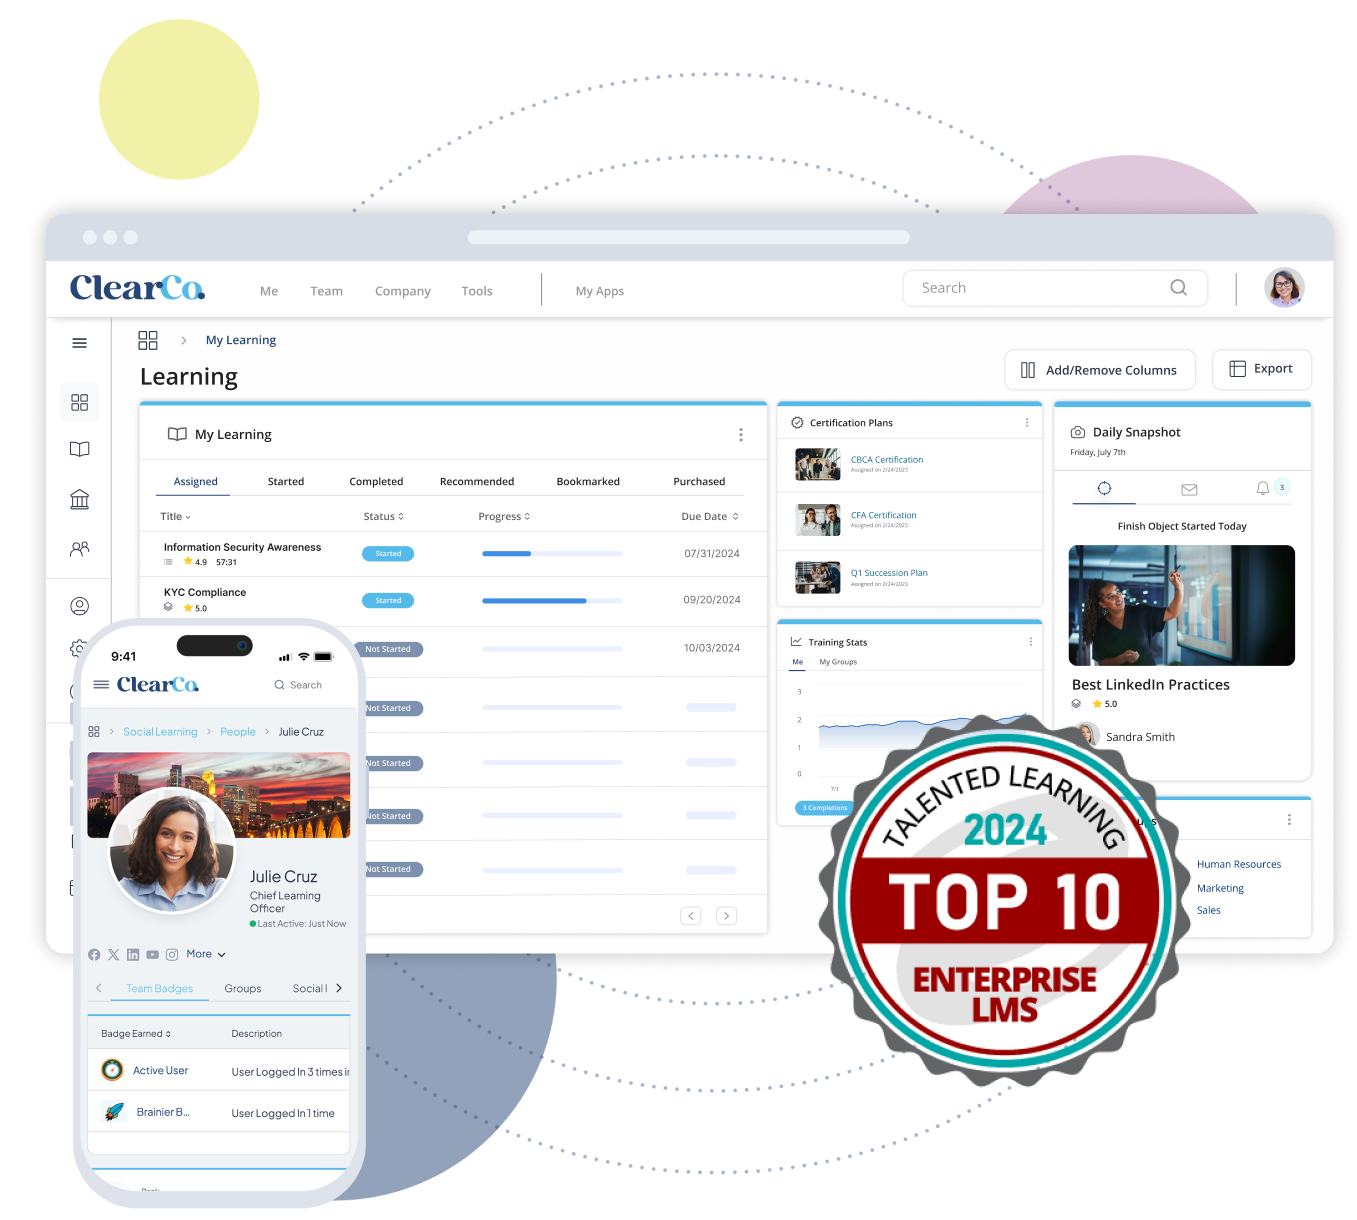
If you’re using an LMS with reporting and analytics, you have access to a wealth of tools designed to help you track, measure, and understand learning activities and outcomes. Your analytics tools show you how employees are using the system — what courses they take, how well they perform, and where they might need more support. LMS reporting features allow you to track learner progress and determine if courses are leading to the desired learning outcomes.
For example, you can track course completion rates to see if learners are abandoning training halfway through. You can measure user engagement — like how often employees interact with training materials or revisit key topics — and analyze assessment scores to identify knowledge gaps.
Still looking for the right LMS? Simplify your search with our list of questions to ask LMS vendors.
LMS analytics shine a light on blind spots so you don’t have to guess what parts of your training programs are clicking and which are driving drop-off. Imagine spotting that 20% of your top performers consistently access a particular module. Now that you know it’s a popular course, you can highlight its value or even use it as a model for future training designs. Or, if you notice a drop-off in completion during a video-heavy course, you could test shorter, more focused clips to keep them hooked.
With LMS analytics in your corner, you can make smarter, data-driven decisions that boost both your employees’ learning experience and your bottom line. By continually refining your training based on real insights, your organization stays agile, your people stay engaged, and your L&D efforts deliver real results.
4 Types of Learning Analytics
Understanding the different types of learning analytics can change the way you approach training and development. These categories help break down all that data into actionable insights, so you can address performance gaps, forecast trends, and refine your learning programs. Here's a closer look at the key types of learning analytics and what they can do for you.
1. Descriptive Analytics: What Happened?
Descriptive analytics is the rear-view mirror of data analysis, looking at past events to give you a clear picture of what happened in your training programs. Metrics like course completion rates, attendance figures, and engagement levels fall into this category.
For example, if 80% of employees didn’t finish a mandatory compliance course, descriptive analytics highlights that for you. Maybe a group of learners scored unusually low on their assessment quiz. With this data, you can recognize patterns or trends that might be pointing to deeper issues, like a confusing course layout or overly dense material.
2. Diagnostic Analytics: Why Did It Happen?
If descriptive analytics tells you what happened, diagnostic analytics answers the question of "why," diving deeper into the data to uncover root causes. Maybe a group of learners failed to complete a course on compliance because the training clashed with a major project deadline. Or, learner feedback flagged outdated content as a reason it’s not resonating.
Thanks to LMS analytics, you can understand the “why” and take precise actions to address those problems. You might adjust training schedules or update materials. Diagnostic analytics ensures you’re fixing the cause of L&D issues, not just band-aiding the symptoms.
3. Predictive Analytics: What Might Happen?
Predictive analytics is arguably the most exciting type of LMS analytics, using your data to forecast future outcomes. Based on patterns and trends, this type of analytics can predict learner performance, engagement levels, or which employees might need extra support.
Imagine you’re able to identify a team that's likely to struggle with new software training because they found previous tech modules challenging. With predictive models, you can proactively provide additional resources or supplemental workshops, helping your team stay ahead of the curve.
4. Prescriptive Analytics: What Should Be Done?
LMS analytics are truly revolutionary because they allow you not just to understand what happened, why it occurred, and what might happen next. It also provides solutions for what it uncovers by combining all of those insights to suggest specific, actionable steps. Think of it as having a built-in advisor for your L&D programs.
For instance, if engagement drops during long training sessions, prescriptive analytics might recommend breaking them into shorter, more interactive modules. Or, if the data indicates that gamification improved completion rates in one module, it could suggest applying the same strategy across others.
Why These LMS Analytics Types Matter
Each type of learning analytics plays an important role in optimizing your LMS strategy. Descriptive analytics lays the foundation by showing you what’s happening. Diagnostic analytics digs into the reasons behind the data, while predictive analytics prepares you for what’s to come. And finally, prescriptive analytics makes the leap from knowledge to action, empowering you to make impactful decisions.
Leverage all four to create data-driven learning programs that engage employees while improving performance and driving measurable results.
6 LMS Analytics to Track (And Why)
Keeping tabs on the right LMS analytics metrics can transform your training programs from trial-and-error to a fine-tuned machine. That is, as long as you know what to track and why it matters. Below are key analytics metrics every L&D team should monitor and how they can drive better outcomes.
1. Completion Rates
Completion rates are the bread and butter of LMS analytics, telling you if learners are sticking with and finishing courses. High completion rates often signal that the content is engaging and accessible, and learning paths make sense. Low completion rates might point to areas needing improvement or courses that are irrelevant.
If you notice a particular course has a drop-off point midway, it’s your cue to dig deeper. Maybe the information is getting outdated, or the format needs tweaking. Simplify concepts, add interactive elements, or break them into smaller, bite-sized modules to keep learners engaged.
2. Learner Engagement
Engagement metrics measure how learners interact with your content, including participation in discussions, time spent on each module, and clicks on resources. If you see high engagement, that points to meaningful training and development.
Suppose one course sparks lots of discussion board activity while another collects dust. This insight reveals what’s resonating (or what isn’t). You might try gamification or a live Q&A to inject life into the underperforming section. Engaged learners are motivated learners.
3. Assessment Scores
Assessment scores are your window into learner comprehension. They show who’s breezing through material, who’s struggling, and which concepts might be falling short of the mark.
Spotting patterns in low assessment scores can highlight areas where your content might need clarification. Introduce additional study aids, tutorials, or focused workshops to bridge the gap. On the flip side, identifying top performers could help you earmark future mentors, trainers, and high performers.
4. Time Spent on Training
This metric breaks down how much time learners dedicate to different courses and modules. It’s excellent for understanding pacing and identifying content that may be overwhelming or too simplistic.
If employees are speeding through a sales training in half the expected time, the course might not be challenging them enough. On the other hand, if learners spend hours slogging through compliance training, consider simplifying the material or offering on-demand support to prevent burnout.
5. Drop-off Points
Measuring drop-off points shows you exactly where learners abandon courses. If multiple users exit the same module or fail to progress beyond a certain step, your module may have barriers to completion.
Analyze what’s causing any bottlenecks. Are they caused by long, uninspiring videos? Cluttered layouts? Based on these insights, you can streamline content, improve navigation, or introduce elements like progress indicators to nudge learners forward.
6. Knowledge Retention
Retention metrics measure how well employees are applying new skills over time. This can include comparing pre- and post-training assessments, collecting feedback, or observing on-the-job performance improvements.
If scores dip in the weeks or months after training, you may need to reinforce learning with refresher modules, follow-up assessments, or microlearning reminders. Retained knowledge means better ROI on your training investment.
Why These Metrics Make a Difference
Understanding these core LMS analytics metrics empowers you to optimize both the learning experience and organizational outcomes. When you tweak and polish courses based on hard data — not old-fashioned guesswork — you create a system that’s engaging and impactful. By tracking completion, engagement, assessments, and more, you can align employee development with business goals for maximum success.
Leveraging these insights means your L&D programs become driven by data, placing you in the driver’s seat of meaningful, measurable change.
Unlock the Transformative Power of LMS Analytics
Using LMS analytics is more than just crunching numbers. It helps you understand your employees and their learning preferences. It enables you to give them learning experiences that actually help them retain new knowledge and achieve their goals. Let data steer your L&D programs, and you’ll see happier learners and better performance across the board.
But leveraging LMS analytics is just the start — unlocking real business impact takes strategy, inspiration, and the right resources. Ready to bring your learning game to the next level?
Get ClearCompany’s L&D Playbook: A Learning-First Approach to Talent Management for practical tips to build a workforce that’s ready for anything and discover how to align your learning strategies with your business goals.